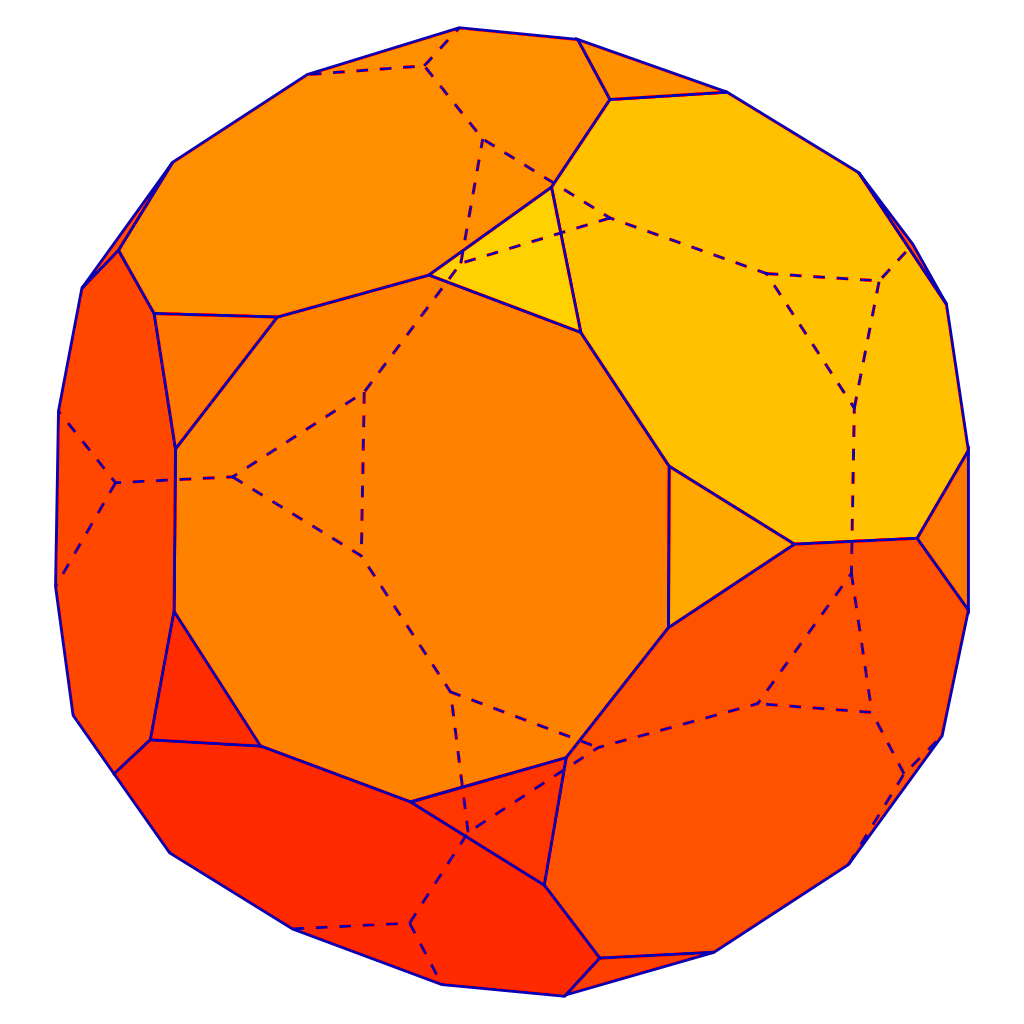
Truncated dodecahedron
 Dodecahedron
A monochrome render of a Truncated dodecahedron by Olfa Wektoryzacja, 2007.
Source: Wikipedia
Defining new types and subtypes
You can define a new type with the following syntax:
type T is...followed by the description of the type, as explained in detail in each category of type.
Formally, the above declaration creates a type and its first subtype named T. The type itself, correctly called the “type of T”, is anonymous; the RM refers to it as T (in italics), but often speaks sloppily about the type T. But this is an academic consideration; for most purposes, it is sufficient to think of T as a type. For scalar types, there is also a base type called T’Base, which encompasses all values of T.
For signed integer types, the type of T comprises the (complete) set of mathematical integers. The base type is a certain hardware type, symmetric around zero (except for possibly one extra negative value), encompassing all values of T.
As explained above, all types are incompatible; thus:
type Integer_1 is range 1 .. 10;
type Integer_2 is range 1 .. 10;
A : Integer_1 := 8;
B : Integer_2 := A; -- illegal!
is illegal, because Integer_1 and Integer_2 are different and incompatible types. It is this feature which allows the compiler to detect logic errors at compile time, such as adding a file descriptor to a number of bytes, or a length to a weight. The fact that the two types have the same range does not make them compatible: this is name equivalence in action, as opposed to structural equivalence. (Below, we will see how you can convert between incompatible types; there are strict rules for this.)
Contours
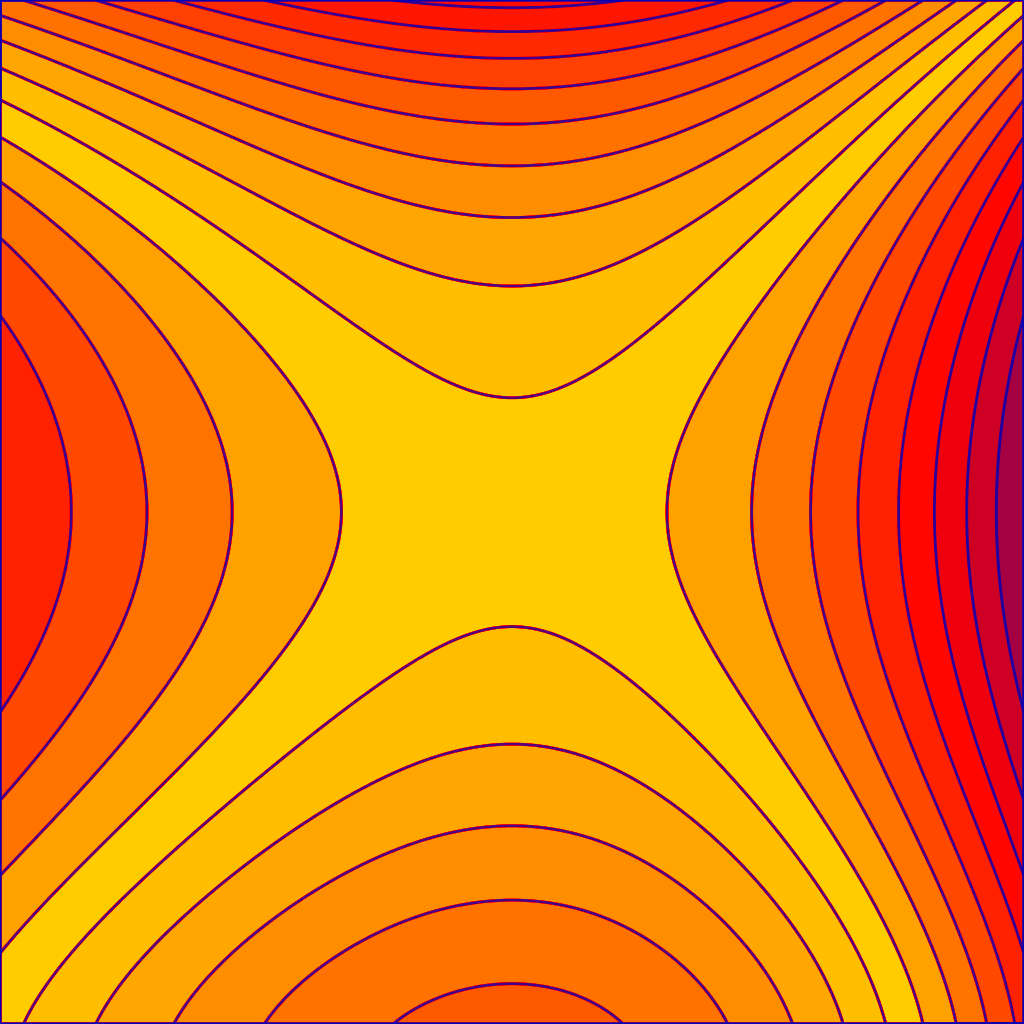 Contours
Contours around a saddle point. Selfmade with Mathematica and Inkscape.
Source: Wikipedia
Matplotlib Colormaps
The mpl colormaps: magma, inferno, plasma and viridis. I previously attempted to implement these in the Cubehelix color space, but the originals are much better. You could presumably plug these colors into a D3 quantize scale, if you were so inclined.
Source: Matplotlib Colormaps
Coastal Graph Distance
This map shows the graph distance of each county from the Pacific or Atlantic coast; it is a recreation of a map posted to /r/dataisbeautiful using TopoJSON. Coastal counties are dark blue, while counties nine or more counties away from the coast are light yellow. (I opted not to reuse the original’s cycling color scale.)
Ahh, my eyes! A deliberately retina-searing variation of the coastal graph distance map.
Source: Mike Bostock
var projection = d3.geo.albersUsa()
    .translate([width / 2, height / 2]);

var path = d3.geo.path()
    .projection(projection);

var color = d3.scale.ordinal()
    .domain(d3.range(9).reverse())
    .range(["#ffffd9","#edf8b1","#c7e9b4","#7fcdbb","#41b6c4","#1d91c0","#225ea8","#253494","#081d58"]);

var svg = d3.select("body").append("svg")
    .attr("width", width)
    .attr("height", height);

queue()
    .defer(d3.json, "/mbostock/raw/4090846/us.json")
    .defer(d3.tsv, "coastal-counties.tsv")
    .await(ready);

function ready(error, us, coastals) {
  if (error) throw error;

  var counties = topojson.feature(us, us.objects.counties),
      neighbors = topojson.neighbors(us.objects.counties.geometries),
      coastals = d3.set(coastals.map(function(d) { return d.id; })),
      nexts = [],
      nexts2 = [],
      distance = 0;

  counties.features.forEach(function(county, i) {
    if (coastals.has(county.id)) nexts.push(county);
    county.distance = Infinity;
    county.neighbors = neighbors[i].map(function(j) { return counties.features[j]; });
  });

  while (nexts.length) {
    nexts.forEach(function(county) {
      if (county.distance > distance) {
        county.distance = distance;
        county.neighbors.forEach(function(neighbor) { nexts2.push(neighbor); });
      }
    });
    nexts = nexts2, nexts2 = [], ++distance;
  }

  var county = svg.append("g")
      .attr("class", "counties")
    .selectAll("path")
      .data(d3.nest()
        .key(function(d) { return d.distance; })
        .entries(counties.features)
        .map(function(e) { return {type: "FeatureCollection", features: e.values, distance: +e.key}; }))
    .enter().append("path")
      .attr("d", path);

  d3.timer(function(elapsed) {
    county.style("fill", function(d) { return d3.hsl(d.distance * 10 - elapsed / 10, 1, .5); });
  });
}
Cayley Torus
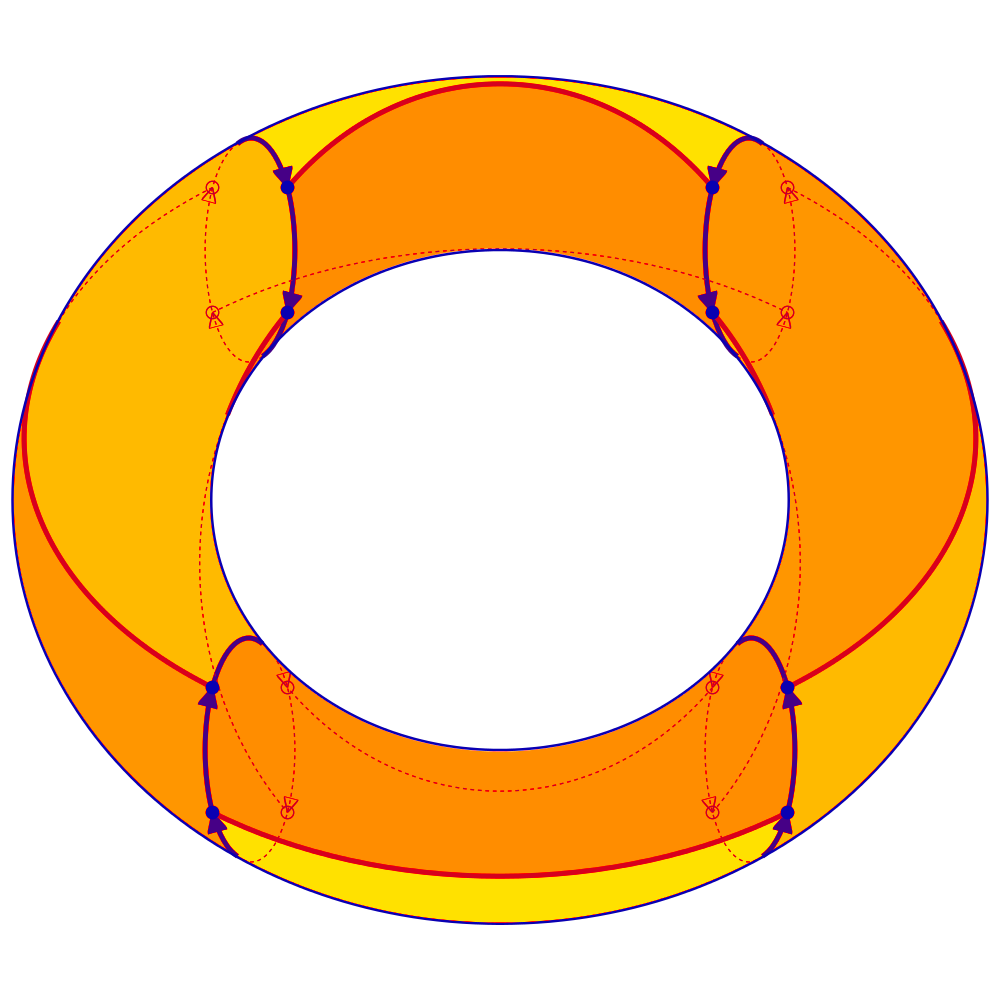 Cayley Torus
Un des 9 groupes non-abéliens d’ordre 16 est le produit semi-direct de C_2^2 par C_4. On peut dessiner le graphe de Cayley de cette présentation sur une surface de genre 1, qui sera divisée en 8 régions, et coloriée avec 4 couleurs.
Source: Wikipedia